Transported image. source ![]()
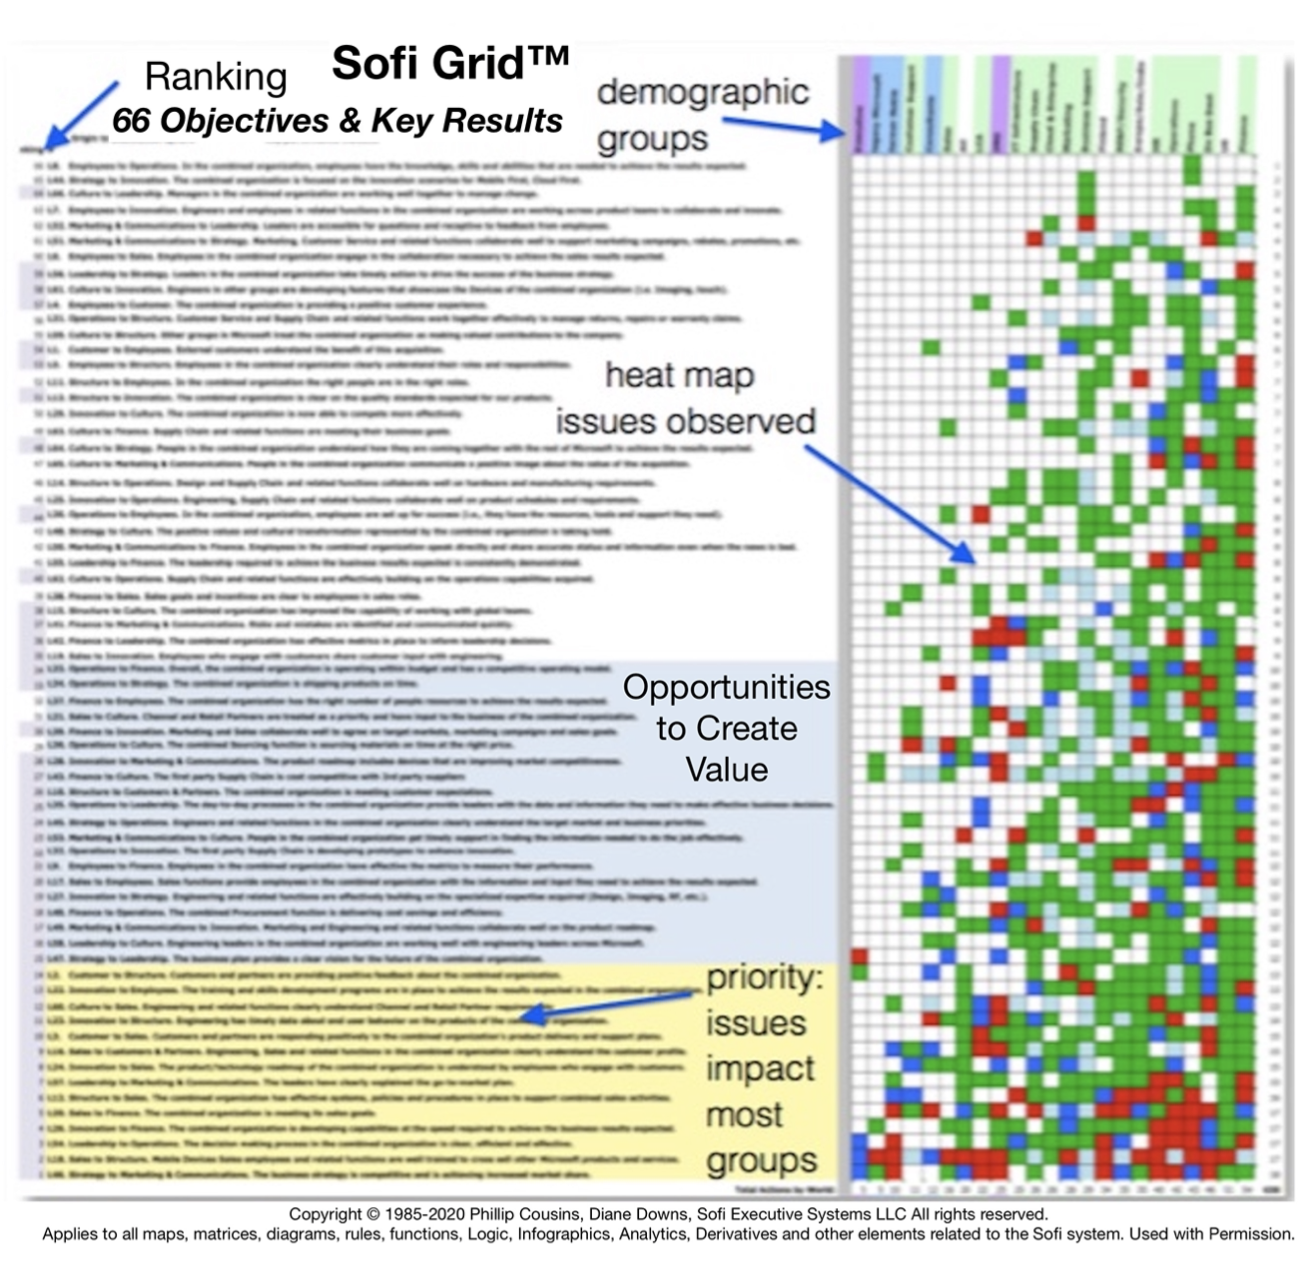
Sofi Grids and Graphs instrument looks into the health and vitality of enterprise across all teams in the entire organization. The Grid produces a "Heat Map" of the enterprise activity.
The status of every group in the organization appears all at once on the Grid. The vertical axis prioritizes the 66 key activities linking the eleven Spheres. The horizontal axis organizes the Worlds of work in the organization according to their impact on efficiency and effectiveness, measured by the number and kind of issues they are facing.
To define the issues and actions, we transform the color-coding scheme of the Influence Map to indicate the cells of your enterprise that need attention. Organizational strengths that appear as thick Green links on the Influence Map become White cells that measure effectiveness. Thin Green Links often relate to Yellow areas of caution in different Spheres, becoming Green cells measuring the need to take action that strengthens these activities. The analysis i of Blue and Red colors on the Influence maps remains the same. Blue is an unknown; Red is a barrier.The transformation of the color-coded instructions defines what kind of creative action is needed to improve performance excellence.

Transported image.
source ![]()
See "A Communication System" and "A Guide for Communication"p.553.